
Graphic Photos on this page.
Physical Exam
Several abnormalities might be noted in an animal with a heart problem. Most of these are due to poor perfusion of the target organ or fluid buildup due to changes in preload and afterload.
- Difficult breathing or coughing due to fluid buildup in the lungs (pulmonary edema) or thoracic cavity (pleural effusion). This can be picked with the stethoscope during auscultation (listening to) of the heart and lungs. The term we use for an increased in lung sounds due to pulmonary edema is called rales.
- Pale or bluish mucous membranes (cyanosis or anemia). This is noted when we look at your pet’s gums. Capillary Refill Time (CRT) might be prolonged.
This video shows how we check the CRT
- Distended abdomen (ascites) due to back pressure of blood not flowing from the back of the body into the right heart properly.
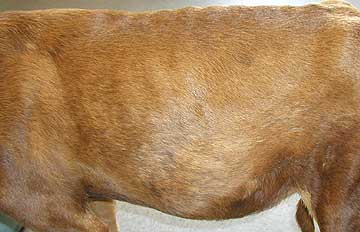
This Doberman with heart failure shows the typical appearance of a distended abdomen caused by ascites. There are other diseases that can cause this look, including Cushing’s disease.

We tap the fluid off to make it much easier for this dog to breathe and also to analyze it and make sure there are no cancer cells. We will also pull this fluid off when it occurs in the chest, called pleural effusion.
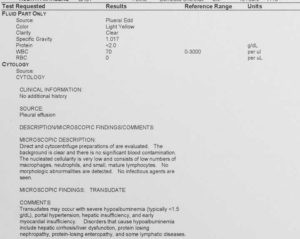
This is a typical report we get when we analyze pleural effusion fluid on a dog with heart disease
Distended jugular veins due to back pressure of blood not flowing from the head to the right heart properly. Right heart failure can be a cause of the ascites you just learned about.
This short movie shows distended and pulsing jugular vein
Pulse deficit- a lack of synchrony between the beating heart and the pulse.
- An increased heart rate (tachycardia)
- A heart murmur during auscultation with the stethoscope
- Cool extremities to the touch
- Reduced mental capacity
Diagnostic Tools
Blood Panel
Many pets with heart failure are senior pets, so it is common for us to run a routine blood panel. There are no specific blood panel tests that diagnose heart disease in dogs and cats, although we can see indirect evidence of heart problems and their consequences sometimes. Also, the blood panel lets us assess problems in important organs like the kidney and liver that can occur simultaneously with heart disease in senior pets. This becomes important when we use medication to treat heart disease.
Thyroid Test
Our lab routinely performs a thyroid test on the blood panel for senior pets since a low thyroid level can be a cause of heart disease. This disease is called hypothyroidism, and occurs in dogs. A high level of thyroid hormone, called hyperthyroidism, occurs in cats, and can also cause heart problems. All pets 8 years of age or older should be checked for this hormone imbalance on a yearly basis.
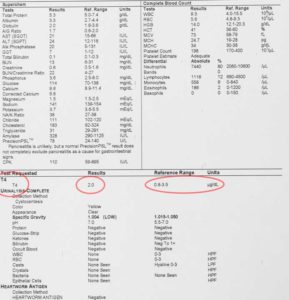
The thyroid level is important in many diseases, so it automatically included in our full blood panel. It takes a special lab to be able to monitor a hormone that is measured in micrograms per deciliter (see reference range in report above).
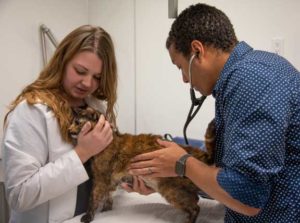
Stethoscope
A very important tool in the diagnosis of heart disease is the stethoscope. This simple yet elegant instrument allows us to hear the valves of the heart as they open and close, and also to hear the rhythm of the heart as it contracts. The name stethoscope comes from the Greek word “to spy on the chest”. It was designed in 1816.
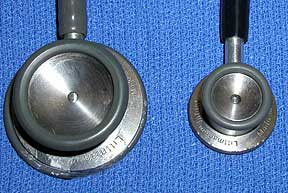
We work with a wide variety of species, so we use different stethoscopes depending on the size of the pet. Each stethoscope has 2 different sized diaphragms, allowing us to hear heart sounds of different frequencies.
Animals have a normal arrhythmia, called sinus arrhythmia. This arrhythmia is an alternation in the rhythmic beating of the heart that coincides with breathing. This can easily be heard with the stethoscope. It is perfectly normal, yet does not occur in humanoids.
The stethoscope really comes into play for an animal that has a heart murmur. A heart murmur is a turbulence of blood flow as it goes through the heart valves (mitral or tricuspid). In a perfectly normal heart the blood flows past the valves silently, and all we hear with the stethoscope is the rhythmic lub-dub of the heart valves as they open and shut. If a murmur is present there is a whooshing sound mixed in with the lub-dubs, almost like the sound of a washing machine. Click on the heart murmur link above to hear a murmur.
This murmur is caused by blood becoming turbulent as it passes through an abnormal heat valve, although other problems can cause a murmur, the most notable being anemia. As we stated earlier, young animals can have an innocent murmur that resolves on its own and does not cause any problems.
Heart murmurs are graded from 1 to 6. One is barely audible with the stethoscope, 6 is so loud that you can feel the murmur with your hand on the chest (the technical word for this is a thrill oddly enough). In general, the louder the murmur the more significant the disease, although this does not apply in all cases. Mitral murmurs tend to be louder due to the large difference in pressure (pressure gradient) between the left atrium and left ventricle.
In addition to their loudness, murmur have other audible characteristics. The sound can increase or decrease in intensity, a term we call crescendo or decrescendo. Murmurs that do not change in intensity are called holo.

This rabbit is getting its heart checked by Dr. Wood as part of a pre-anesthetic exam before being neutered with our laser
It takes many years of practice to properly auscult the heart with a stethoscope on small animals that are not cooperative and have rapid heart rates (not to mention that also purr a lot)! This is our cardiologist Dr. Fred Brewer showing one of our students how to listen to this cat’s heart.

Even though it is a challenge to properly auscult the heart of a dog that is panting or a cat that is purring, their heart rates, although high compared to humanoids, are slow compared to an avian heart. A bird heart routinely beats well over 300 times per minute.
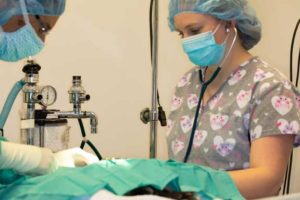
We use the stethoscope almost continuously in surgery to monitor anesthesia
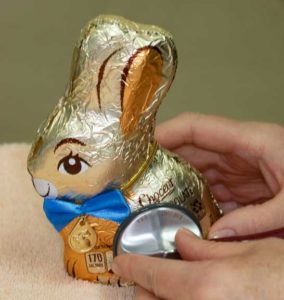
If you get a chocolate bunny at Easter you can practice your auscultation skills!
Electrocardiogram (EKG or ECG)
As you already learned cardiac muscle (myocardium) is unique in its rhythmic beating. This rhythm is analyzed with an electrocardiogram. What the EKG measures is the depolarization (losing their electrical charge) and repolarization of the heart muscle as the cells contract. We talked about the mechanism of this in the cardiac muscle section in regard to sodium, potassium, and calcium. The EKG line that is produced measures the direction of the electrical activity along with its magnitude. Since the atria are smaller in size than the ventricles, their magnitude on the EKG strip is smaller.
What an EKG report looks like
The hardest part about performing an EKG on an animal is keeping it still enough to get a good reading. Sedatives are not used since they can interfere with the results. Interpreting the EKG is a medical art, and requires the familiarity of the electrical differences of many different breeds of dogs and cats.
If our cardiologist is not available we use a service that allows us to transmit the ECG through the telephone or via fax to a group of veterinary cardiologists that specialize in EKG’s. In addition to interpreting the EKG, they also give us a cardiac consultation via fax the next day (or within a few minutes if it is an emergency).
Our cardiologist, Dr. Fred Brewer, does his EKG’s on a computer
We use the EKG in several situations. The first is for a dog or cat that is older or might have the symptoms of heart disease, especially coughing. We also use it prior to any anesthesia in high risk pets or when there is significant concern about anesthesia in general . We have a complete page on anesthesia to learn more.
An EKG alone cannot determine if heart failure is present. It can be helpful in determining that heart failure is not present. We need other information from the Diagnostic Process, along with an echocardiogram, which you will learn about later in this page.
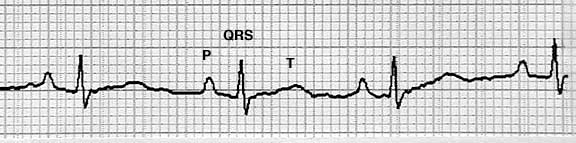
This EKG is from a pet that stayed still long enough for us to get a reading. It shows almost 4 complete beats of the heart.
We enlarged one of the 4 beats to help when we explain below
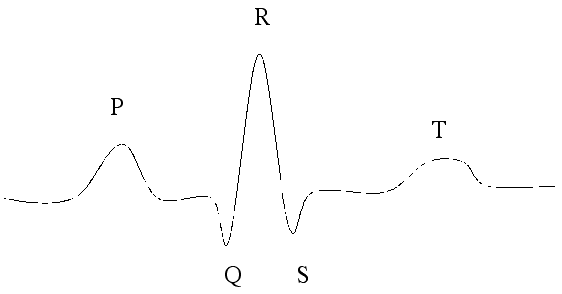
P-Wave
When the SA node fires it stimulates the cells of the atria to depolarize. The EKG picks this up as a small positive deflection on the strip
QRS Complex
As the electrical current flows into the ventricles during depolarization the EKG produces the 3 distinct wave patterns that make up this complex. There are 3 peaks because of the way the current spreads in the ventricles, going from inside to outside. These 3 peaks are larger than the P-Wave because the size of the ventricles are much larger than the atria.
T-Wave
When the ventricles re-polarize they produce the T-Wave. Re-polarization in general should produce a negative peak on the ECG strip, but because it is occurring in the opposite (outside to inside this time) direction as the depolarization of the ventricles, the peak is positive on the EKG strip.
This is a teaching EKG to show you some of the arrhythmia’s we are looking for
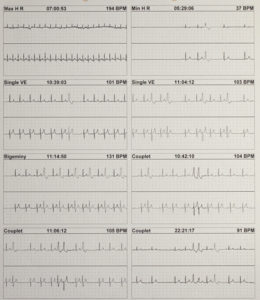
If the EKG is normal yet we still suspect an arrhythmia, we use a device called a Holter Monitor to keep track of your pet’s heart rate and rhythm over several days. This way we don’t miss anything.
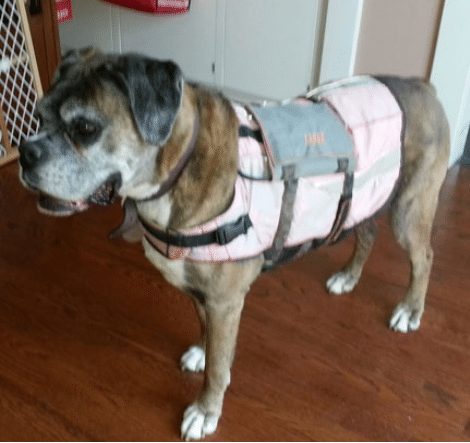
The holter monitor is in a comfortable harness
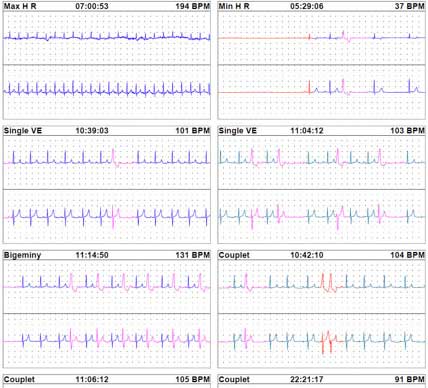
This is some of the EKG data it generates over 24 hours
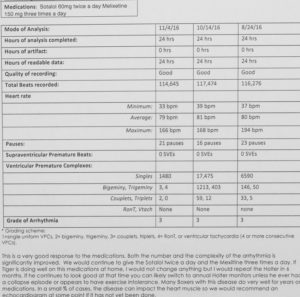
This is a Holter Monitor report after analysis by a cardiologist
Let’s look at a few of the abnormalities the EKG is good at detecting….
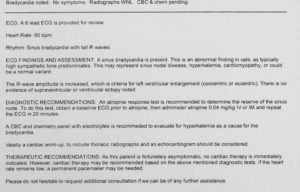
Bradycardia
An abnormally slow heart rate is called bradycardia. On the EKG strip this is noted as less P-waves, QRS complexes, and T-Waves per minute. For the average dog, this means a heart rate (HR) less than 60 beats per minute, and for the average cat, less than 80 beats per minute. This varies with breed and size. A severe bradycardia can cause a dog or cat to become weak, have a low blood pressure, and literally pass out (syncope). It passes out because of inadequate perfusion to the brain cells.
Listed below are some causes of bradycardia:
-
- Respiratory disease
- Gastric ulcer
- Hypothyroidism
- Hypothermia (low body temperature)
- Hypoglycemia (low blood sugar)
- Drugs
- Hyperkalemia (high potassium)
Heart Blocks
These are a group of disorders that occur when the electrical current that flows from the atria to the ventricles is disrupted. They are identified as 1st, 2nd, and 3rd degree.
1st Degree Heart Block
This is a minor problem that is detected on the EKG strip as a prolonged time between the P-Wave and the R-Wave. This means there is a prolonged conduction across the AV node. It might be normal, from digitalis therapy, or due to hyperkalemia. Treatment is not required usually.
2nd Degree Heart Block
This slightly more important problem is detected on the EKG strip as a P-Wave without a corresponding QRS complex following it. It arises when there is a failure of the SA node to activate the ventricles after it has activated the atria. This means there is a failure of the SA node to stimulate the AV node. It could be normal on some dogs, caused by respiratory disease, or even caused by digitalis again. Most dogs are not treated, although atropine can be used.
There is a version of the 2nd Degree Heart Block called the Mobitz Type II that has the potential to be more severe. In this case the current does not pass through the bundle of His or bundle branches. If the heart rate becomes slow enough it can reduce cardiac output. It can be caused by scar tissue in the heart muscle, death of heart muscle cells, infection, and cancer. It can lead to a 3rd Degree Heart Block, so when it occurs, it needs to be monitored.
3rd Degree Heart Block
In this serious arrhythmia there is no coordination between the atria and ventricles. There will be P waves and QRS complexes, but they will not be in their usual coordination of a P Wave before every QRS and a QRS after every P Wave. The cause might be congenital, low oxygen, inadequate blood supply to the heart cells, inflammation, trauma, hyperkalemia (high potassium), cardiomyopathy, surgical trauma, and digitalis.
Tachycardia
This is an abnormally fast heart rate. For the dog this means over 160 beats per minute, for the cat, over 200 beats per minute. This varies with breed and size. It is detected on the EKG as a high number of P-Waves, QRS complexes, and T-Waves per minute.
It can be caused by heart failure, pain, fever, hyperthyroidism in cats, anemia, and of course, excitement. When the underlying cause is treated the problem tends to go away.
Radiography
An excellent tool in the diagnosis of heart disease is radiography. The size of the heart and pulmonary vessels, along with fluid buildup in the lungs, can be seen in a radiograph. We will show you some normal radiographs first, then some abnormal ones. You might one to come back to the normal ones to refresh your anatomy as you view the abnormal ones. Before we get to the radiographs lets review some thorax anatomy

You might want to do a more detailed review at our heart anatomy page
We will also show you radiographs of pets with breathing problems that are not the result of heart disease. This shows the importance of radiography in diagnosis, and emphasizes the need to follow the diagnostic process at all times. Don’t forget that changes in the lungs can eventually cause the right heart to fail (cor pulmonale).

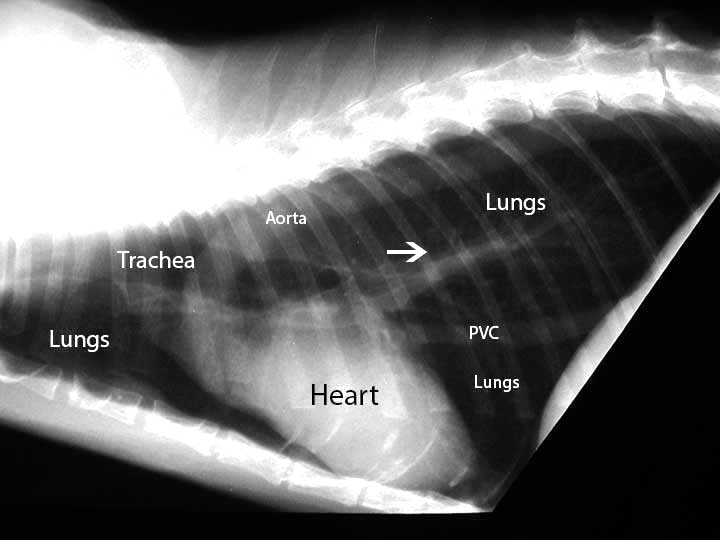
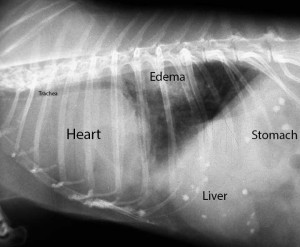
Normal dog heart and lungs side view (called a lateral view). The head is towards the left. The trachea is in the correct location and is of the proper size. The dark lungs are readily visible along with the normal sized heart. PVC is posterior vena cava.
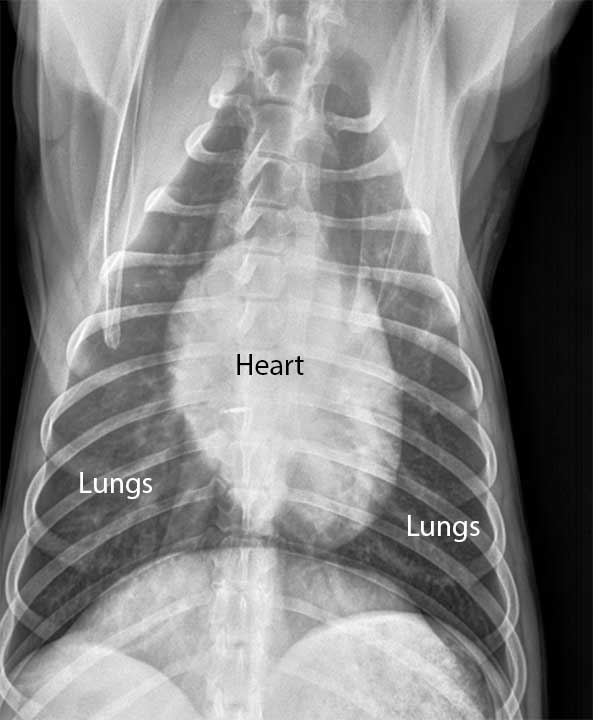
Normal dog heart and lungs top view (called a DV (Dorsal-Ventral) view). The heart is the correct size, and it is surrounded by normal lung tissue. The lung tissue is black because it is filled with air. The white semicircular area at the bottom is the diaphragm.

There is significantly more information in a chest radiograph than just the trachea, heart and lungs. In this radiograph you can see the aorta along with an artery (A), bronchus (B), and vein (V) to the cranial lung lobe. Changes in the size of these veins and arteries give us clues as to whether heart disease is present along with the cause of the heart disease.

An even close view of the artery (A), bronchus (B), and vein (V)
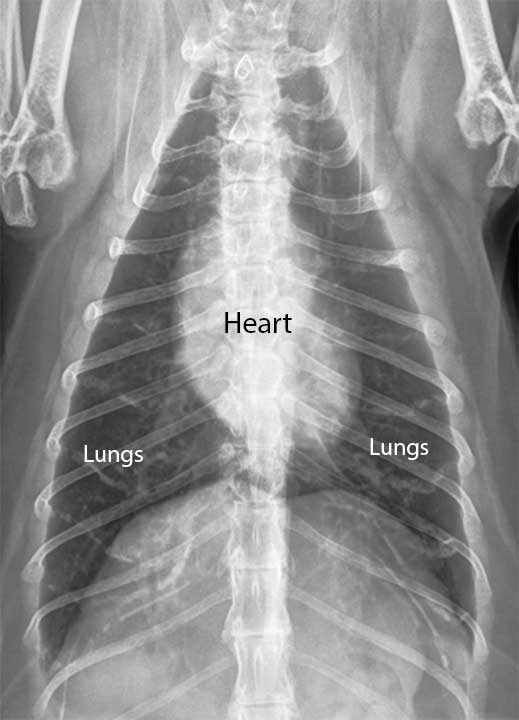
Normal cat heart and lungs side view. You can see the same structures as the dog radiograph. Do you see the artery, bronchus, and vein to the cranial lung lobe? They are smaller than the dog, but they are present. Do you also see the posterior vena cava? The arrow points to it.
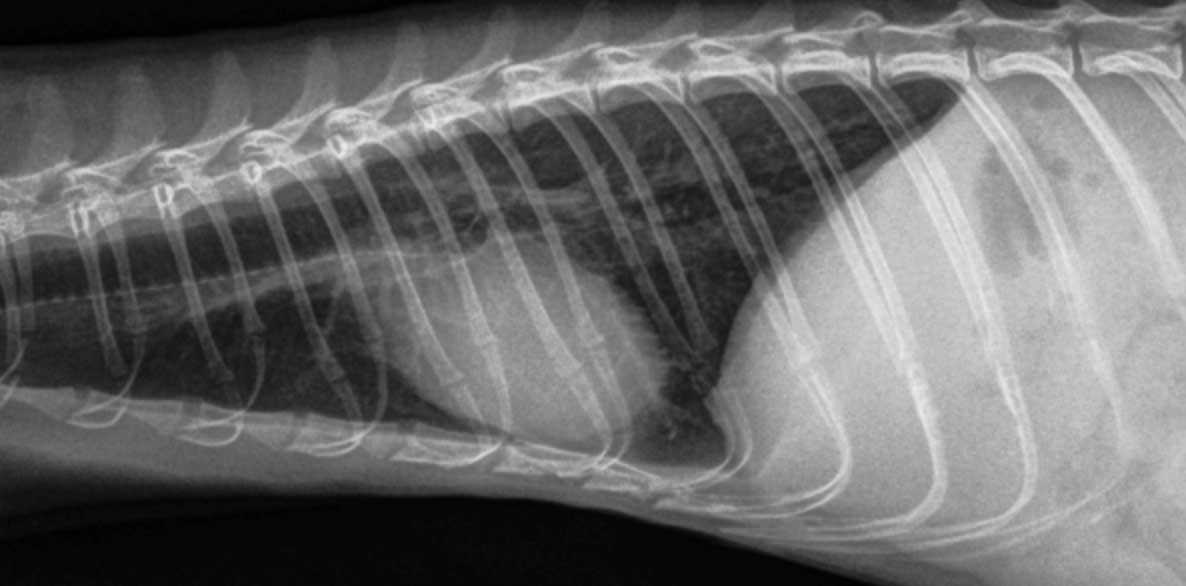
A cat from the top view (DV). Its not easy to get a cat to sit still to take this radiograph!
We work on all different kinds of critters that get heart disease. This ranges from ferrets, to rabbits, to guinea pigs to rats. They all show different symptoms, and it is not easy to diagnose them in these species
This is a ferret chest radiograph
Guinea Pig chest radiograph
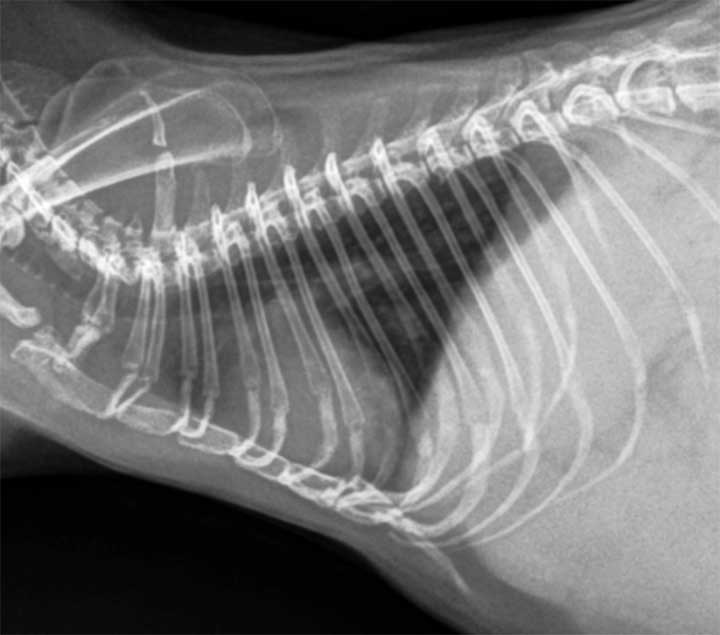
An enlarged heart is called cardiomegaly. There are several parameters we use to give us an indication a heart is enlarged. These parameters are variable, and depend heavily on the breed of dog. We will show you a dog with heart disease. We put a normal heart radiograph first for comparison.
This dog in the following radiographs has a very large heart (cardiomegaly). Not all pets with heart disease show such obvious and extreme changes. Many changes are subtle, and do not show up well on a web site at low resolution, so an extreme one is used for better understanding. We would hope to see a dog like this long before the radiograph progressed to this point.
This is a normal dog chest radiograph to help in visualizing the dog with the heart problem below
The radiographic diagnosis is elevated trachea, mainstem bronchus compression, loss of caudal waste, loss of cranial waste, pulmonary edema, and increased sternal contact
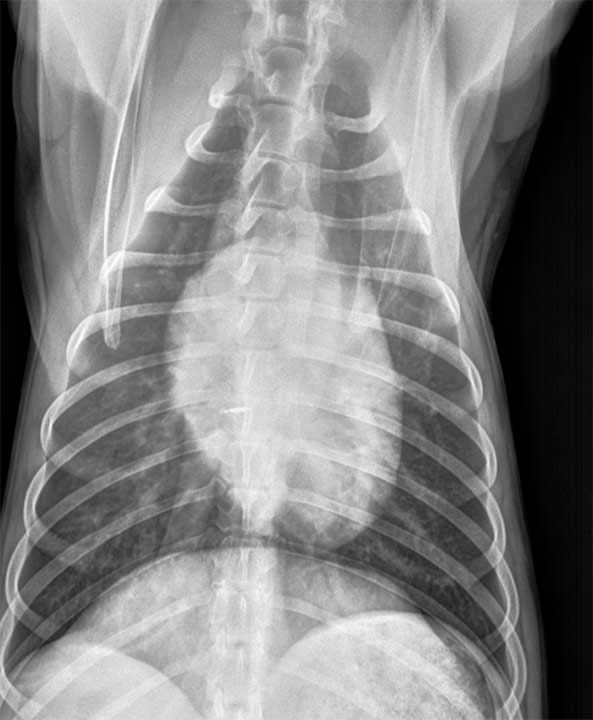
Normal dog DV view for comparison

The same dog as above that has cardiomegaly on a DV view

Not every enlarged heart (cardiomegaly) on a radiograph is a sign of heart disease. This cat has an apparently enlarged heart with an elevated trachea. In this case it is caused by a diaphragmatic hernia, where the liver has literally torn through the diaphragm and resides in the thorax.

Sometimes the hernia is not so apparent, and makes it look just like an enlarged heart
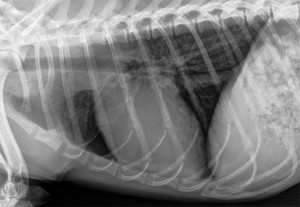
Radiographs are also used to diagnose pulmonary edema, which is fluid buildup within the lungs themselves. It is a sign of congestive heart failure. All the whitish area at the the top right of the lungs is the fluid. Normally this area should be black because it is filled with air.

This is a large amount of pulmonary edema

A close up of the edematous (fluid filled) area in the lungs
When the left atrium is enlarged it is also a sign of heart failure. We can see an enlarged left atrium radiographically if it is large enough.
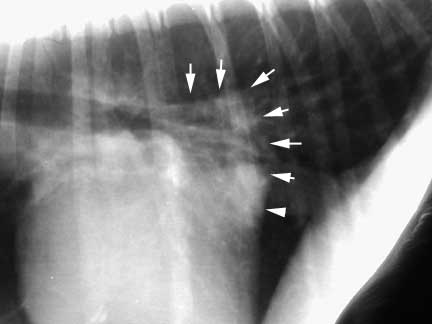
The arrows point to a very enlarged left atrium at the arrows
The previous radiograph changes of pulmonary edema (congestive heart failure)were due to failure of the left side of the heart (left atrium and left ventricle). If the right side of the heart goes into failure, the radiograph might show fluid in the abdomen and no changes in the thorax. Fluid the builds up in the abdomen is called ascites.

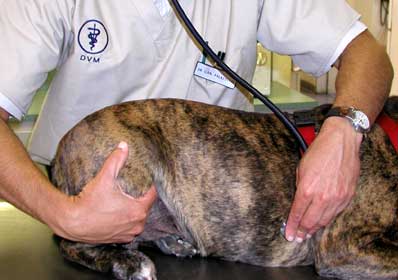
Draining ascites fluid from an abdomen of a dog with right sided heart failure
Heart disease is not the only problem that can cause ascites. Several other conditions can give this radiographic appearance, especially FIP in cats and cancer.

This cat has ascites, which is fluid buildup in the abdomen. If you compare it to the radiograph below it you can see that individual internal organs are not visualized. This is because the organs are surrounded by fluid. The dark areas are air in the stomach and in the intestines.
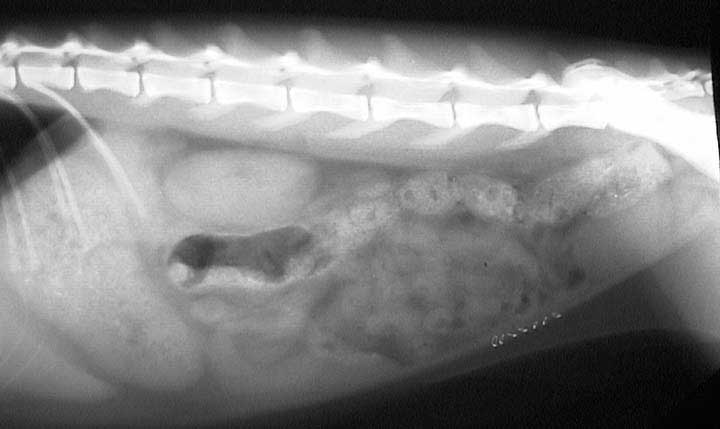
This normal cat abdominal radiograph shows all the distinct internal organs for comparison to how the fluid above obscures them
Time for a break from all this radiology stuff. Lets look at something fun. It is the beating of the heart of a tortoise that is undergoing bladder stone surgery. Click on the video and enjoy the beat.
Echocardiogram
An echocardiogram of the heart is almost indispensable in detecting a significant number of heart problems. Echocardiography refers to the imaging of the heart with ultrasound. Echocardiography may be divided into three types based on the instrumentation and application. These are M-mode, Two-dimensional, and Doppler Echocardiography.
M-Mode

This image is useful to measure the thickness of the ventricular walls along with size of the cardiac chambers. With these measurements a formula is used to determine cardiac contractility.
Two Dimensional
This image gives us an overall view of the heart. We can look into the chambers and see the valves in action. We can also see fluid around the heart if it is present.

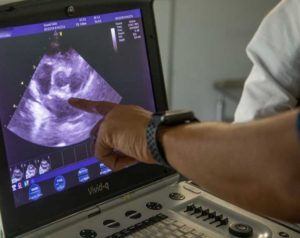
This ultrasound picture shows the left ventricle (LV), aorta (AO) and left atrium (LA)
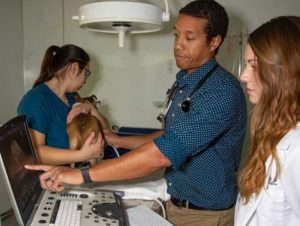
Echocardiograms require the expertise of an expert. In this photo our cardiologist Dr. Fred Brewer is teaching one of our student externs.
He is pointing out the valves between the chambers of the heart
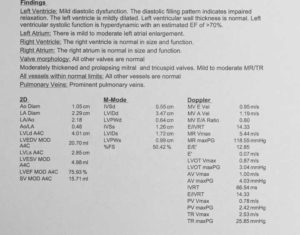
After many calculations are performed this is the report we get
Doppler
The Doppler view allows visualization of the blood as it literally flows through the heart. It is usually performed simultaneously with the Two Dimensional image. It can sometimes help us detect the degree of valvular disease by measuring the speed at which the blood flows through the abnormal valve.

In the top half of this ultrasound picture the 2 parallel running vertical lines are the doppler measuring the blood flow through the mitral valve. The “MR” at the bottom half of the picture is the doppler measuring the intensity of the mitral regurgitation that is occurring.

The color doppler makes it easy to visualize the blood flow through the heart valves
Click on the movie below to watch the color doppler in action (and listen to our cardiologist talk to one of our students). Notice how fast this heart is beating. Remember our earlier lesson on heart failure, and one of the ways the body adapts to a heart that is not pumping enough blood is to increase the heart rate. That is occurring in this case.
The Doppler Echocardiogram allows visualization of the blood as it flows between the chambers of the heart